Most autumns when I worked for Natural England and its predecessors, I would get at least one letter, phonecall or email from a student who wanted to do a project on woodland. There was often an assumption that there was a standard survey method that would give them ‘the answer’. Some were rather put out when my reply was that it depended on what your question is and what resources you have available, but of course it does.


Surveyors recording vegetation structure, woodland ponds and general condition in different ways
Partly to address this issue the Nature Conservancy Council produced a compilation of simple methods for conservation surveys. A couple of years back I was asked if it could be updated. A preliminary assay highlighted how much our knowledge of British woodland had improved, partly because of new techniques, but largely because there is now so much data potentially available via the internet.


Cover of the original handbook and example of an ancient woodland inventory sheet.
Back in the 1980s we were still trying to finish the first set of Ancient Woodland Inventories. The Inventorers pored over old maps in libraries and record centres, tracing outlines and annotating a master sheet for each site with different coloured pens. Aerial photographs up to ten years old were used to infer the current state of the site but were not always available for the sites of interest. Now this sort of work can be done much more quickly and accurately using GIS, on-line historic maps and Google Earth images. Local environmental data on pollution levels or from climate models can easily be downloaded for anywhere in the country.
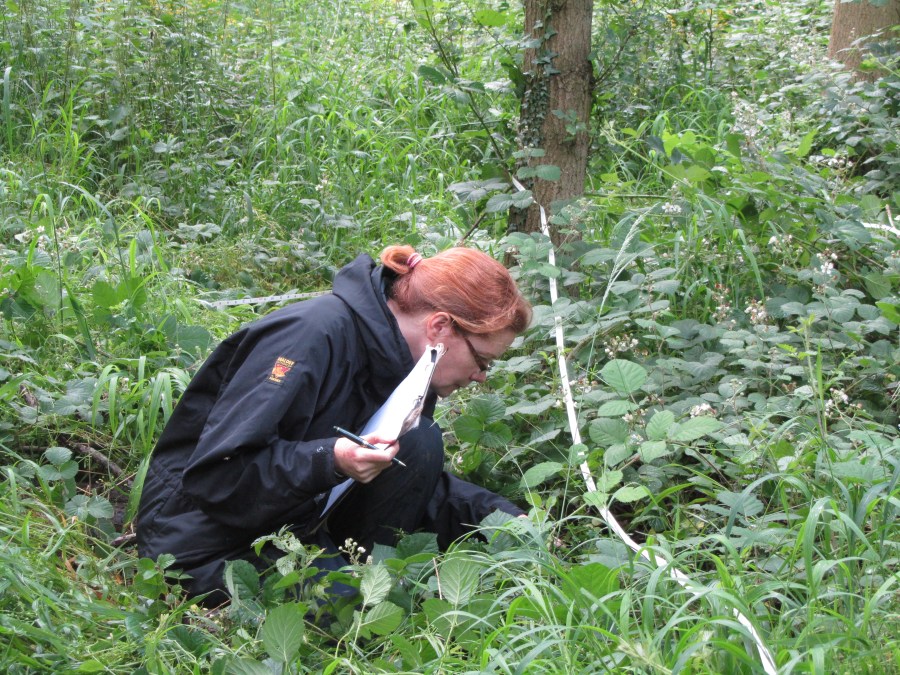
Sent out into the field we would plod round woods armed with a clipboard, pen and perhaps a set of quadrat poles on our back. Actually, this is still largely how I still do a lot of my survey work, but the development of data loggers, allowing direct entry of records on site is becoming increasingly common. More time may be required to do the recording itself online, but there is less scope for error and there is no second step of data entry required.


Recording in the field is fun in the sun, but someone has to input the data afterwards.
Features of interest would be drawn and marked on sketch maps in relation to woodland boundaries, rides etc. Photographs were taken but under shade the quality was often not very good. Since you paid for developing the film before you could find out if it was useful or not, you tended to be cautious about many pictures you took. Now it is so easy to take digital images, the more the merrier, and simply delete those that do not work or are duplicates. Unknown plant species no longer need to be picked as a specimen but can be photographed and uploaded to sites such as Ispot for others to identify. Rather than relying on pacing and compass-bearings to navigate, hand-held GPS allows you to know where you are in the wood to a few metres or so, depending on the season and quality of the machine.


The sort of sketch map used in the past to show a small marshy area and a photo of the same sort of feature today.
Detailed surveys of the structure of stands, such as in the Lady Park Wood transects, tended to be summarised down to diameter distributions, with perhaps tree height and brief tree form descriptors, and a map of where the tree bases were. Airborne or hand-held Lidar imaging can now provide three-dimensional views of a stand down to the smallest branches. Drones can be used to explore the woodland canopy which remains a largely under-sampled part of the woodland system.


Drones are increasingly used to explore woodland canopies, eDNA has opened up the soil microbiota.
Even more of a black box was what was happening below ground. There were no easy ways of looking at what microbial or fungal species were present and how they varied across a wood or wider landscape. eDNA techniques are starting to be available that can provide some indicators of the species present and their significance.
There is still an issue of how many of the records collected gets fed back into data-bases such as the National Biodiversity Network or local record centres, but it is at least much easier to copy and distribute electronic data. It is also increasingly a requirement of funders that data are made available in some form.
Anyway, we decided it was still worth updating the survey handbook and it will be available from Pelagic Publishing via the internet in February.


