Nearly 45 years ago I started work for the Nature Conservancy Council in Cumbria as a lowly ‘Phase 1’ habitat surveyor. In those days it meant walking footpaths and scanning the countryside with binoculars from roadsides – attracting the attention of passers-by, irate land-owners, or occasionally even the police.
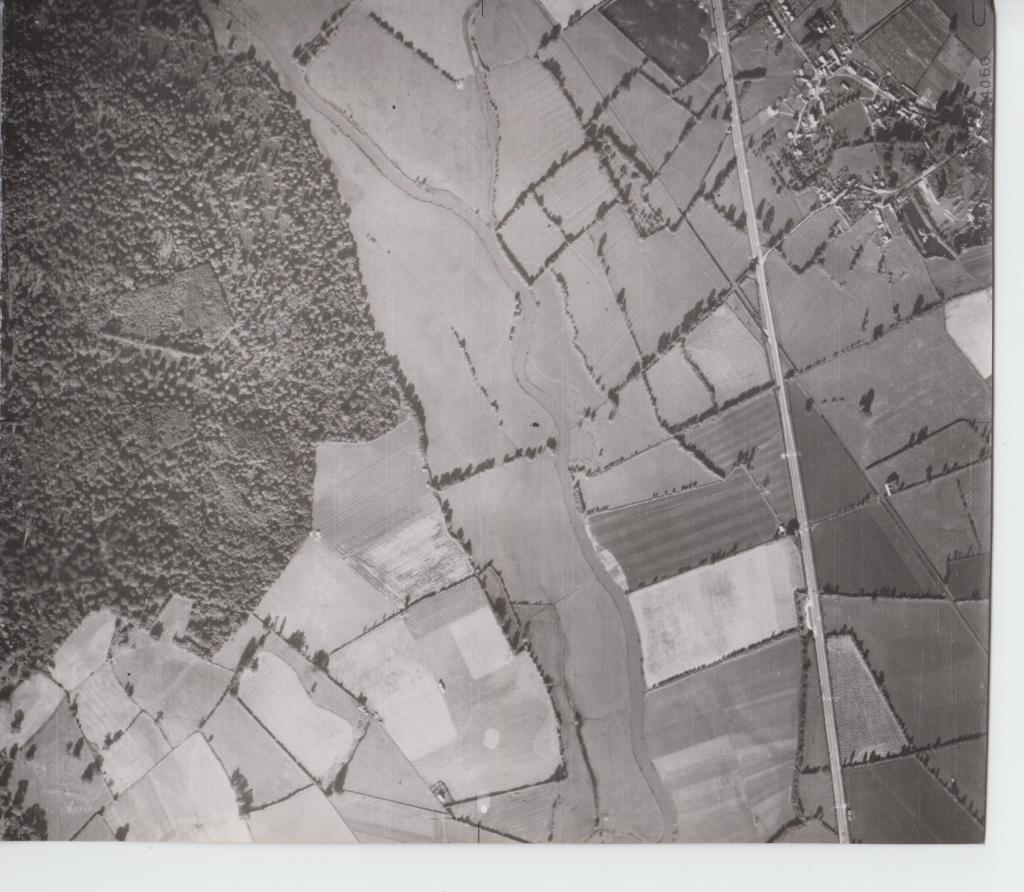
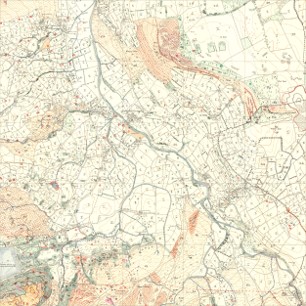
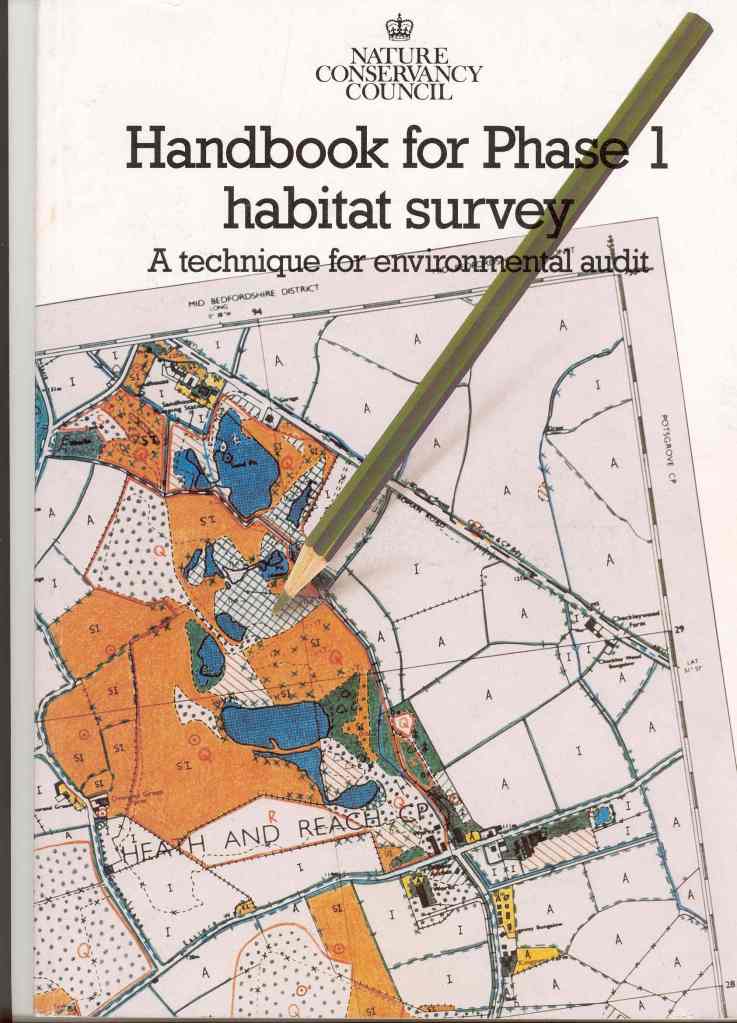
We might, if lucky, have been able to consult a black-and-white aerial photograph before we went out, but the chances were that it would be at least 5 years old and interpretation of any land-cover variations shown could often be tricky. So, we would sketch the boundaries of the vegetation types seen in the field on to photocopies of 1:10,000 maps, add a symbol for a ‘target note’ – then scrawl a brief summary of the main species or state of the vegetation into a paper notebook or clipboard sheet.
Back at base, on rainy days, we would transcribe our observations to a 5×5 km 1:10,000 map sheet, colouring in the different vegetation types using standard Lakeland pencils, although I had to rely on the pencil label to tell the difference between blue (freshwater) and purple (bog) – a drawback of partial colour-blindness. The targets notes were written out in full, so that they could be given to a typist; the typescript would then need to be checked and corrected.
Maps such as these continued to be produced across the country through the 1980s. They provided a picture of the distribution and extent of habitats and the changes that were taking place prior to the easy availability of remote-sensed resources. In Wales a heroic effort was made to digitise them, and then summarise what they showed about the state of the landscape (Blackstock et al., 2010). However generally the maps and notes were cumbersome to copy and I am not sure that any of the ones that I contributed to have survived.
The whole process now sounds almost medieval, the equivalent of monks producing illuminated manuscripts, prior to the age of printing. However, it was a great opportunity for me gain experience in species identification, understanding vegetation and to see the impacts that changes in agricultural and forestry practices were having on the ground. Many of my conservation colleagues also served an apprenticeship as Phase 1 habitat surveyors.

For much of my subsequent career, paper and a clipboard remained my main way of making field notes: you can also use a clipboard for holding down barbed wire fences, as a level surface to stand your lunchtime coffee on, and for fanning away midges. However direct input of data to ruggedised laptops and mobile phones has become common for most professional (and many amateur) surveys. Other forms of remote sensing such as Lidar are increasingly used to measure woodland structure and variations in the soil surface such as boundary banks and other earthworks, without even having to visit the wood.
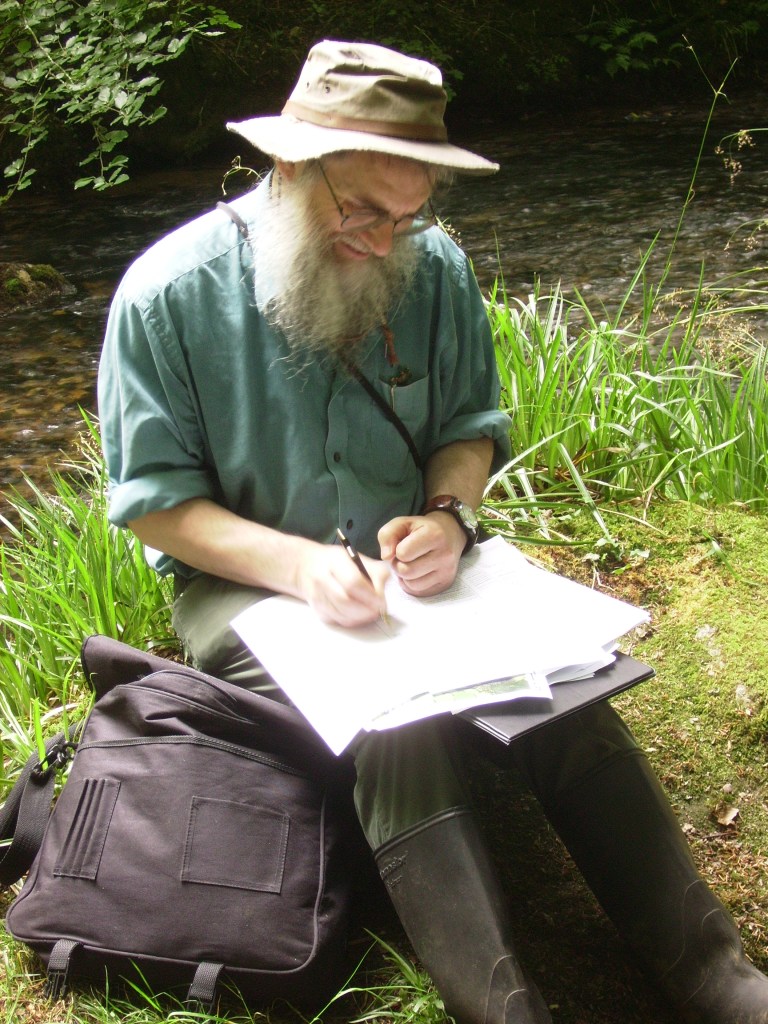
The introduction of cheap digital cameras has transformed my use of photographs to supplement, sometimes replace, the clipboard notes. Google Earth images and online historic maps have also proved a great boon, both before visiting a site and in the subsequent write-ups. However there is still no substitute for actually walking the wood if you want to get full picture of the species present. I don’t suppose I am going to go far down the direct field-input route, but I have just experimented with recording notes and taking photographs on a walk round a wood using Input software. This captures the location, so the note and picture can subsequently be directly imported into GIS system and displayed on a map.

No giant leap for the ecological-kind generally perhaps, but one small step for the old man.

And like medieval illuminated manuscripts a source of contemplation and meditation both in the production and subsequently. Thanks Keith for a trip down memory lane.
LikeLiked by 1 person
I did Phase I survey too! A rite of passage back then… mine was in Huntingdonshire though, which was not especially challenging. I remember getting very excited about finding Lotus corniculatus…
LikeLiked by 1 person